

The benchmark trap, and what a decade of crisis has taught us about measuring digital development
For almost thirty years, I’ve made the same argument about Puerto Rico. I made it at industry conferences in Miami in the late 1990s, in San Juan while protesters marched against the sale of the telephone company, at the CANTO congress in the Bahamas in 2003, and in a 2009 article published by Signals Telecom Consulting’s blog titled “Moving Forward the Economic Agenda with Inaccurate Internet Statistics.” I have made it a string of columns since.
The argument is simple: a United States non-incorporated territory cannot fix what it does not measure, and it cannot measure what it compares with the wrong peers. In March 2016 I wrote that a flattering ranking can do real damage, because it tells policymakers there is nothing left to fix. If there’s no problem, there’s no need for remedies.
A decade later, Puerto Rico lived through a fiscal collapse, a federal oversight regime, catastrophic hurricanes, and a wave of federal broadband funding. It has given that argument more evidence than anyone would have wanted. So, it is worth revisiting what the island has taught us, and what it teaches regulators well beyond the Caribbean.
A ranking that measured the wrong thing
In 2015, the World Economic Forum’s Networked Readiness Index placed Puerto Rico 44th among 143 economies. In Latin America and the Caribbean, only Chile and Barbados ranked higher. It was an encouraging headline, and the wrong comparison.
Puerto Rico’s spectrum policy, universal service programs, and broadband subsidies are decided in Washington, D.C., not San Juan. Against the United States, ranked seventh in the same index, the island’s position looked very different. Its weakest scores were precisely the ones controlled by its local government: government procurement of advanced technology (99th) and the government’s vision for ICT-led development (79th).
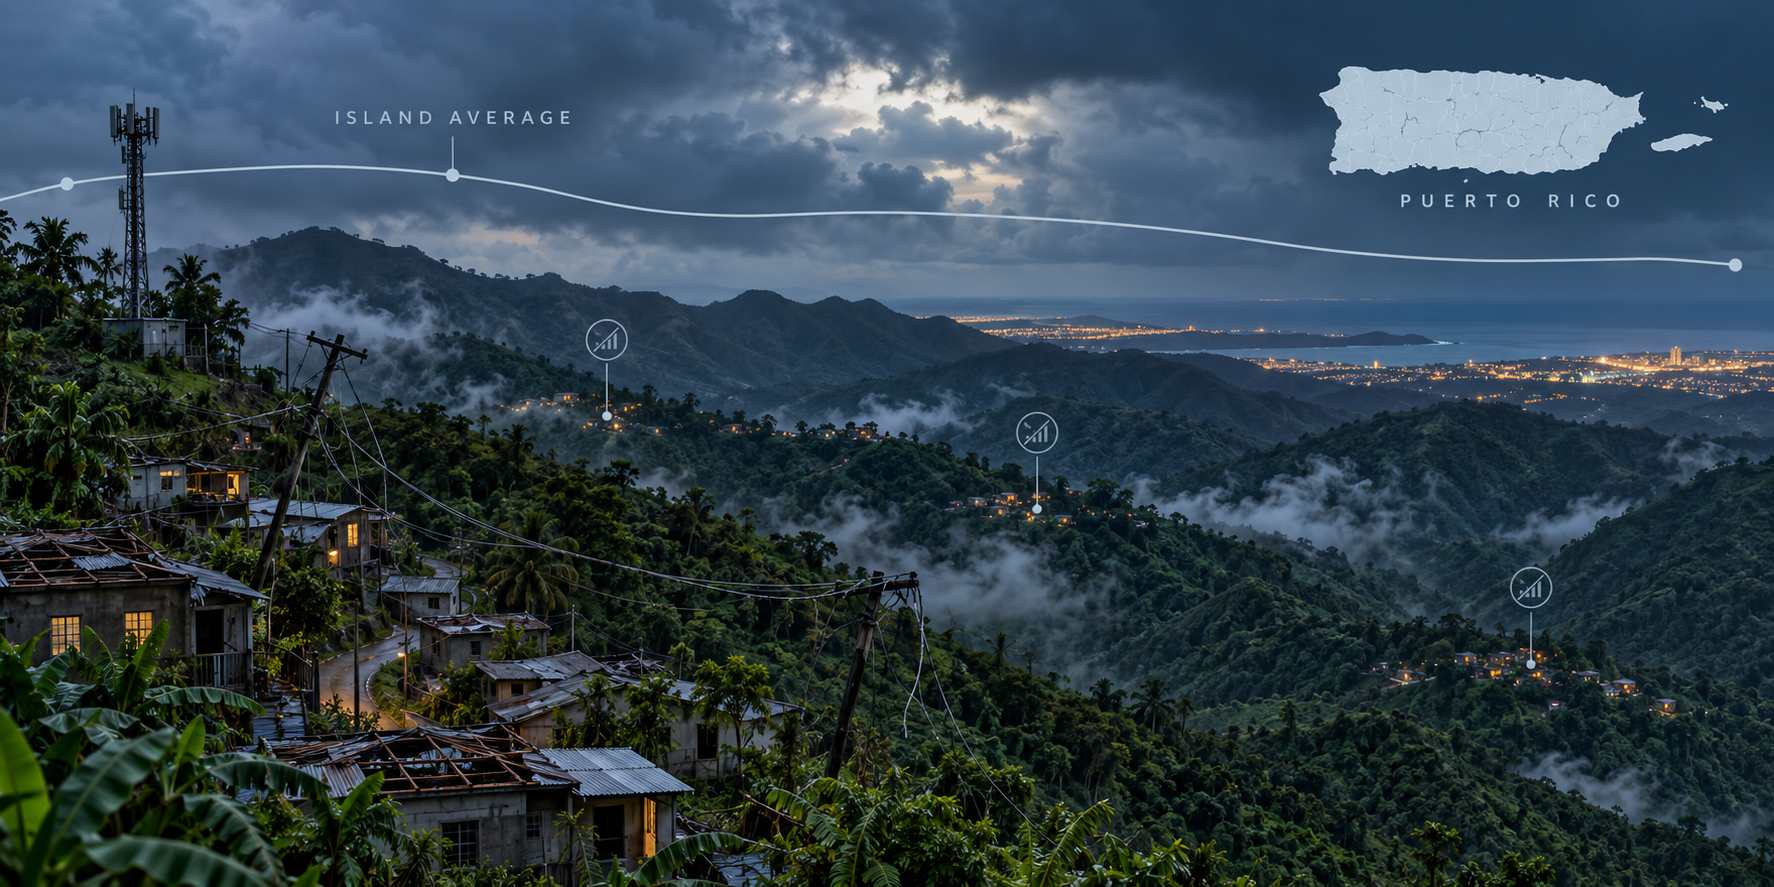
Eighteen months later, the index’s blind spot became impossible to ignore. After Hurricane Maria struck in September 2017, the FCC reported that more than 95% of Puerto Rico’s wireless cell sites were out of service, with 48 of the 78 municipalities having lost all of them. According to studies conducted by George Washington University and Harvard University, at least 2975 to 4645 people died on the island (higher than the 64 deaths reported by Puerto Rican authorities), and 90% of households applied for federal assistance.
No readiness ranking had asked the question that mattered most: what happens to the network when the power goes out?
When the averages hid the mountains
Two months after the storm, I compared the recovery figures published by Puerto Rico’s telecommunications regulator with those of the FCC.
The local figures were island-wide totals. They came with no definitions of what was being counted and no breakdown by municipality. The regulator’s cell-site count did not match the FCC’s: 2,671 versus 2,696. Its service figures added wired and wireless connections together, even though the two networks had suffered very different damage, which made the overall picture look better than it was.
The FCC’s municipal data told a different story. On November 20, 2017, only 24 of the 78 municipalities had more than half of their cell sites working. The island-wide numbers concealed the situation in mountain towns such as Utuado, Lares, and Jayuya, many of which still had no electricity and were advised not to drink their tap water.
That is the benchmark trap at its most consequential: a single average standing in for dozens of different realities, while hiding the communities that needed help most.
What a decade did to the island
The economic backdrop has changed profoundly since 2016. Three months after my column, Congress passed PROMESA, which created a federal oversight board and a court-supervised process to restructure the island’s debt. In January 2022, the court confirmed a plan of adjustment for the Commonwealth’s debts and closely linked public authorities, and it took effect that March.
The power utility is another story. In June 2026, the oversight board was still proposing new settlement terms to bondholders in its effort to end the electric authority’s bankruptcy, nearly a decade after it began.
The demographic trend I described in 2016 has deepened. By 2025, about 3.2 million people lived in Puerto Rico, 17% below the 2004 peak of 3.8 million, with the steepest decline between 2014 and 2018. The population is aging, and it earns far less than the mainland. In 2024, the median household income on the island was US$26,700, compared with US$70,200 for Puerto Ricans born and living on the mainland, and the child poverty rate on the island was 49%.
Every digital policy question on the island now must be answered for a smaller, older, lower-income population. That makes getting the measurement right more important, not less.
Compare with the right peers
Puerto Rico operates under the same federal rules and funding programs as the states, so it should be benchmarked against other US jurisdictions. The available data makes that case clear.
Against the mainland, Puerto Rico’s progress is real but incomplete. The share of island households with broadband rose from 56.2% to 76.7% between the 2014–2018 and 2019–2023 Census estimates. Nationally, 90% of US households had a broadband subscription in 2021. For fixed broadband specifically, Puerto Rico had the lowest adoption rate of any state or territory, at 35.7% of households, in the 2016–2020 estimates.
Even among US territories, Puerto Rico does not lead. The 2020 Island Areas Censuses found broadband subscriptions in 85% of households in Guam and 79% in the US Virgin Islands.
Compared with Latin America as a whole, Puerto Rico still looks like a leader, but not across the board. Uruguay has led the region in fixed broadband penetration, with 32 subscriptions per 100 inhabitants in 2023. Behind that figure is a deliberate public policy. Since 2011, the state-owned operator ANTEL, which holds a monopoly on fiber-to-the-home services, has deployed fiber across the country, reaching 100% coverage of services previously supported by copper in 2023. The investment was driven by a government universalization program, not by the search for a commercial return.
In the Caribbean, Barbados has set the regional benchmark: Flow completed its fiber-to-the-home network across the island and describes Barbados as the only territory in the region with 100% FTTH coverage.
Puerto Rico’s ambitions have been more modest. The FCC’s post-Maria program aimed to bring every location on the island at least 100 Mbps, with gigabit service at nearly one-third of them.
Even this comparison illustrates the trap. Uruguay’s figure counts subscriptions per inhabitant, Barbados reports fiber coverage, and Puerto Rico’s Census data measures households that actually subscribe. None of these numbers can simply be lined up against the others.
As I argued in 2021, fixed services are sold to households, so their penetration should be measured per 100 households, not per inhabitant. The same number of connections can mean very different levels of access depending on the average size of a home. Mobile coverage figures that ignore technology are just as misleading: a country covered mostly by 2G and one covered by LTE and 5G can both report more than 90% of the population under coverage.
This is not a technical quibble. Badly designed statistics do more than distort rankings; they entrench the digital divide. When the data cannot show which communities lack adequate service, which technologies they depend on, or which devices they can afford, policy and investment flow to where the numbers look worst on paper, not to where the need is greatest. The communities hidden by the averages, like the mountain towns after Maria, remain hidden, and the divide persists precisely because no one can see it. Designing connectivity policy on such data is like prescribing the same medicine to every patient in a hospital without asking what they are sick with.
Uruguay also shows that even 100% coverage is an average. A study published this year in Telematics and Informatics found that ANTEL’s fiber program raised average individual incomes, but with mixed effects on inequality. Deployments began in each department’s capital, favoring those already well positioned. The income gains were also uneven: regions with more educated populations, stronger digital environments, and closer proximity to the capital captured more of the benefit. Universal coverage did not mean universal gains. The distribution of benefits followed the distribution of skills and geography, which no coverage map will ever show.
Compared with its Latin American and Caribbean neighbors, then, Puerto Rico is a leader on some measures and a follower on others. Compared with the jurisdictions that share its rulebook, it is catching up. Neither comparison is wrong on its own. The trap is picking the one that flatters and mistaking it for the one that informs, because a flattering statistic is also a statistic that hides.
Numbers that mean different things in different places
Some statistics look identical across countries but measure different realities.
Mobile penetration is a classic example. Historically, most of Latin America used a calling-party-pays system, which encouraged multiple prepaid lines per person. The United States, and therefore Puerto Rico, used a mobile-party-pays model. As a result, US jurisdictions appeared to lag in mobile penetration even when their networks are more advanced.
The region’s geography also shapes its fiber success stories. Uruguay and Barbados are relatively flat, with concentrated populations, while Puerto Rico is mountainous, with its population spread across 78 municipalities. The cost of reaching the last household is not comparable, and neither are rankings that ignore it.
The data got better. The questions got harder.
In April 2019 I reviewed the telecommunications statistics published by Puerto Rico’s regulator, and the problems were basic:
- It added fixed and mobile broadband connections together and divided them by total population, counting the same households twice.
- It did not appear to use the FCC’s definition of broadband.
- It grouped 79% of all connections into a single category running from 5 to 100 Mbps, which made any analysis of speeds meaningless.
- Meanwhile, the island’s statistics institute was still offering science and technology data from 2009.
I ended that column by asking readers to imagine knowing, municipality by municipality, what speeds households actually subscribed to. An investor could then compare technology adoption in Bayamon, Arecibo, Luquillo and Culebra.
Seven years later, federal data is close to that. The largest share of the Broadband Equity, Access, and Deployment Program (BEAD) funding was allocated to each state and territory based on its number of unserved locations in the FCC’s Broadband Data Map. On that basis, NTIA allocated Puerto Rico about $334.6 million, noting that 61,871 homes and small businesses on the island lacked access to high-speed internet. In August 2026, NTIA announced that it had approved the final BEAD proposals from all 50 states and six territories.
Federal funding has also begun to reflect the lesson of Maria. After the hurricanes, the FCC allocated $950 million in fixed and mobile support to expand, improve, and harden networks in Puerto Rico and the US Virgin Islands. For fixed broadband, it chose providers through a competitive process that weighted price and network performance, including resiliency, and awarded $127.1 million over 10 years to cover more than 1.2 million locations. Puerto Rico’s own broadband program is now procuring a submarine communications cable system as an investment in resilient infrastructure.
The open question is whether Puerto Rico’s own agencies have adopted the same rigor in what they publish. Unfortunately, they haven’t. Puerto Rico still publishes telecommunications data that was relevant in the 1990s, but that is almost useless in 2026.
Without electricity, nothing else works
In October 2024, I argued that without a reliable power supply, digital transformation cannot materialize. By then, the federal government had committed more than $9.6 billion through the Federal Emergency Management Agency (FEMA) to repair the island’s electric system, and Puerto Rico was still suffering daily blackouts.
This is where the benchmark trap is most dangerous today. Broadband maps measure whether service is available. They do not measure whether it survives a blackout, or how long it takes to come back. On an island whose power utility is still bankrupt, that may be the most important number of all. It is also the one nobody publishes.
The stakes are rising with artificial intelligence: data centers, cloud services, and the computing capacity AI depends on need a stable, affordable power supply before anything else. A national AI strategy that does not begin with electricity is not a strategy for development or innovation. It is a wish list.
Beyond Puerto Rico
Puerto Rico’s case is unusual, but the trap is not. It affects every jurisdiction measured against the wrong peers: the US Virgin Islands, Guam, and the other US territories; the overseas territories of European countries; and above all small island developing states, which are routinely ranked alongside continental markets with entirely different costs, climate risks, and regulatory frameworks.
Small islands can do this well. When I contrasted Puerto Rico with Curaçao in 2017, what stood out was not only its fiber. Its regulator had published a Smart Nation strategy that explicitly named reliable power, disaster recovery, and good governance as preconditions. The difference was not size or wealth. It was the willingness to measure honestly and say publicly where the country was headed.
For small islands in particular, a good ranking can be worse than a bad one. It suggests the work is done just as the next storm is forming.
What I would tell policymakers today
The recommendations I have made for three decades still stand, with a decade of hard evidence behind them:
- Choose peers deliberately. Benchmark against jurisdictions that share your rules, funding, and constraints, and say explicitly why you chose them.
- Publish the details, not just the average. Municipal and location-level data, with clear definitions, measured per household for fixed services and by technology for mobile, is what reveals the communities that aggregates hide.
- Measure resilience alongside availability. Track how long networks stay up during power outages and how quickly they recover, not just how many households are covered.
- Measure who benefits, not just who is connected. Uruguay’s experience shows that universal fiber can raise average incomes while leaving inequality untouched. Coverage targets need to be paired with skills and adoption programs, starting outside the capital.
- Invest in the government’s own capacity. In 2015, Puerto Rico scored lowest in government adoption of technology. Digitizing public services and training the people who deliver them remain the most direct levers any government controls.
In 2016 I argued that transparency was a precondition for reversing the island’s economic decline. I would now add a corollary: a flattering statistic, taken out of context, is a form of opacity too.
Institutions send signals as well. Since that column, Puerto Rico has downgraded its telecommunications regulator from an independent board, the Junta Reglamentadora de Telecomunicaciones (Telecommunications Regulatory Board of Puerto Rico – TBR), to a bureau, the Negociado de Telecomunicaciones (Puerto Rico Telecommunications Bureau – TB), within a broader public service regulator, a demotion that says a great deal about the priority the government gives the sector. There is reason for cautious hope: the bureau’s current leadership has stated that it is reviewing and updating the data it publishes. After thirty years of asking, I will be glad to read the results and to benchmark them against the right peers.
What benchmarks is your country or territory measured against, and are they the right ones?
#PuertoRico #DigitalDivide #Broadband #Resilience #DigitalPolicy.
José Otero has spent 30 years advising regulators and operators in 50+ countries across the Americas, Europe, and Asia on the governance of emerging digital technology. He writes here on the widening gap between what digital technologies can do and the rules, institutions, and infrastructure meant to govern them.
Connect on LinkedIn or reach out at jfo@ICTDconsult.com

